How to fix activation and sales alignment: Introduction
If you’re a Head of Marketing or CMO at a B2B SaaS company or professional services firm, you’ve probably been in this meeting:
Sales: “We need more leads.”
Marketing: “We’re generating more MQLs than ever. Look at the numbers.”
Sales: “Those leads aren’t converting. They’re not ready. They don’t fit. We need better leads.”
CEO/CFO: “So why isn’t the pipeline growing?”
Silence.
Here’s the uncomfortable truth: MQLs are a vanity metric if they don’t turn into pipeline and revenue. And for most B2B companies, the real problem isn’t top-of-funnel volume – it’s what happens after someone raises their hand.
At Intense Digital, we work with B2B SaaS and professional services brands across Africa and the UK, and we see the same pattern over and over: marketing and sales are measuring different things, the handoff is broken, and there’s no shared accountability for what happens between “lead” and “closed deal.”
Let’s fix that.
The Real Problem: Your Funnel is a Handoff, Not a Journey
In most B2B organizations, the funnel looks like this:
- Marketing runs campaigns, content, events → generates leads
- Leads hit an arbitrary score threshold → become MQLs
- MQLs get “handed off” to sales (often via a weekly CSV export or Slack notification)
- Sales attempts to qualify them → some become SQLs, most go into “nurture” (a.k.a. the black hole)
- SQLs enter the pipeline → some close, many stall or go dark
The problem? Every handoff is a point of failure. And no one owns the space in between.
- Marketing is measured on MQLs generated, so they optimize for volume.
- Sales is measured on deals closed, so they focus on the hottest, most ready-to-buy prospects.
- Everyone in the middle – the people who are interested but not yet ready, or ready but not yet convinced – falls through the cracks.
The result: you generate hundreds of MQLs, but only a fraction turn into pipeline, and an even smaller fraction close.
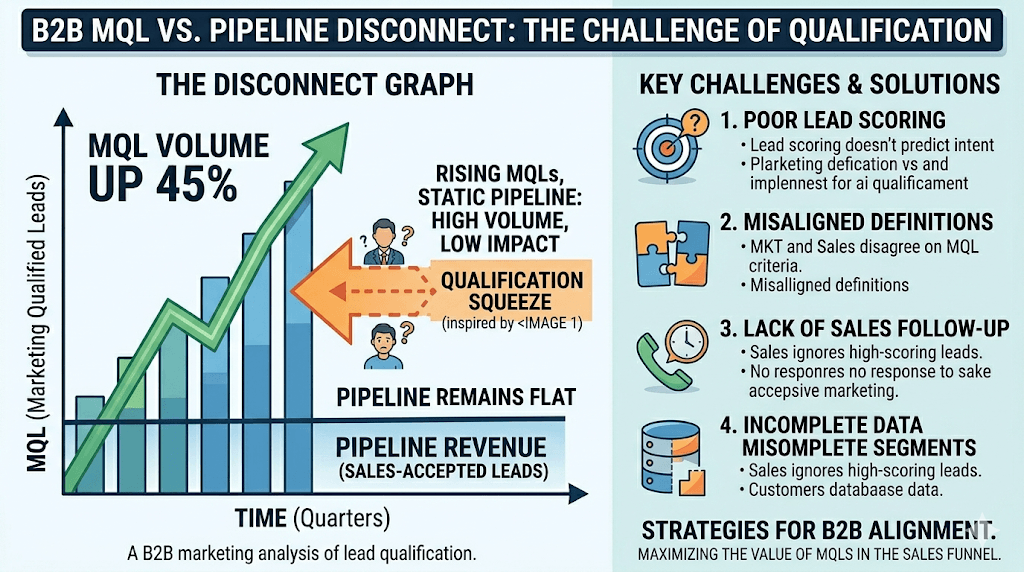
The Five Reasons Your Pipeline Doesn’t Move
1. Your MQL Definition is Disconnected from Sales Reality
Many companies define an MQL as someone who:
- Downloaded a whitepaper
- Attended a webinar
- Filled out a “Contact Us” form
- Hit a certain lead score (e.g., 50 points based on activity)
But here’s the problem: activity doesn’t equal intent, and intent doesn’t equal fit.
Someone who downloaded your eBook on “The Future of HR Tech” might be a student writing a thesis, a competitor doing research, or a junior employee with zero buying authority.
Meanwhile, the VP of HR who visited your pricing page three times, watched a demo video, and checked out your integrations page – but didn’t fill out a form – never becomes an MQL, so sales never sees them.
Fix: Redefine MQL based on fit + intent + engagement, not just activity. Work with sales to agree on what “ready for conversation” actually looks like. And implement intent signals (page visits, time on site, repeat visits) alongside form fills.
2. There’s No Systematic Activation Between MQL and SQL
Let’s say someone books a demo or starts a free trial. What happens next?
For many B2B brands, the answer is: “A sales rep will reach out.”
But when? With what message? How many follow-up attempts? What if the prospect ghosts?
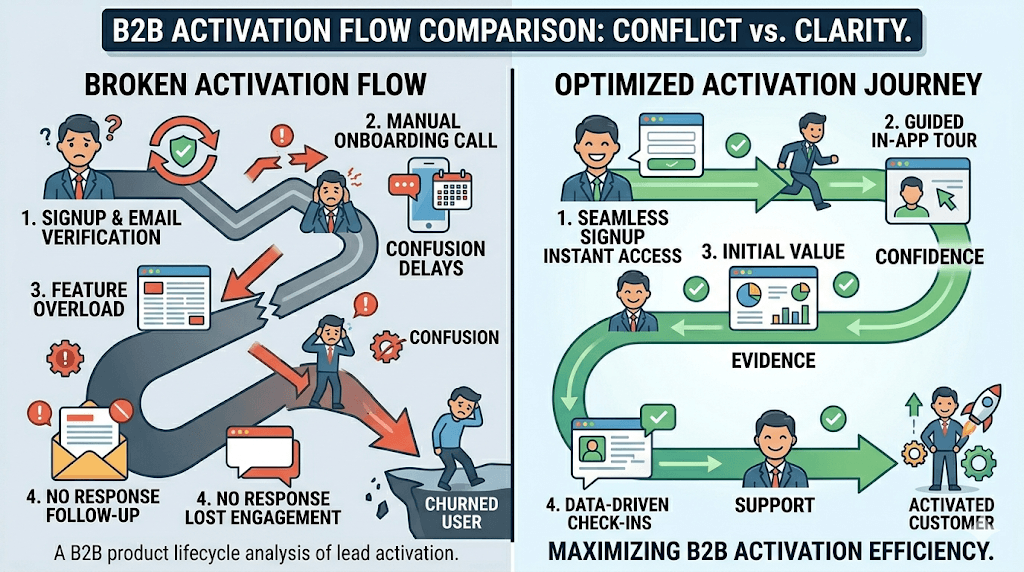
There’s often no systematic activation or nurture between the moment someone expresses interest and the moment they’re ready to have a substantive conversation.
What good activation looks like:
For demo requests:
- Instant confirmation email with calendar link and “what to prepare”
- Reminder email 24 hours before, with agenda and value prop
- If they no-show: automated re-book email + alternative self-serve option (recorded demo, product tour)
- Post-demo follow-up within 2 hours with recap, next steps, and case study
For free trials:
- Welcome email with clear first steps and success milestones
- In-app onboarding flow that guides them to their first “aha moment”
- Triggered messages based on behavior (e.g., “You haven’t connected your data yet – here’s how”)
- Day 3, 7, 14 check-ins via email or in-app message
- Sales outreach triggered by engagement, not arbitrary timing (e.g., “User completed X action → notify sales”)
The goal: Don’t just wait for the prospect to be ready. Guide them to readiness.
3. Marketing and Sales Don’t Share the Same Funnel View
Walk into most B2B companies and ask marketing and sales to show you “the funnel,” and you’ll get two completely different answers.
Marketing’s funnel:
- Impressions → Clicks → Leads → MQLs
Sales’s funnel:
- SQLs → Opportunities → Proposals → Closed/Won
There’s a gap in the middle, and no one owns it.
Fix: Build a single, shared funnel view that both teams use. It should look something like this:
| Stage | Owner | Definition | Key Metric |
| Visitor | Marketing | Website/content visitor | Traffic, engagement |
| Lead | Marketing | Identified contact (email known) | Lead volume, source |
| MQL | Marketing | Fit + Intent signals met | MQL volume, MQL rate |
| Accepted Lead | Sales | Sales has reviewed and accepted | Accept rate |
| SQL | Sales | Qualified as real opportunity | MQL→SQL conversion |
| Opportunity | Sales | Active deal in pipeline | Pipeline value |
| Closed/Won | Sales | Customer | Win rate, deal size |
Track conversion rates at each stage. If MQL → SQL conversion is low, that’s a shared problem. If SQL → Opportunity is low, that’s a sales problem. If Opportunity → Close is low, that might be a product, pricing, or sales execution issue.
Everyone looks at the same dashboard. Everyone owns the conversion rates together.
4. You’re Not Measuring (or Optimizing) Pipeline Velocity
Most B2B marketers are measured on volume – how many MQLs did we generate this quarter?
But volume without velocity is just a clogged pipe.
Pipeline velocity is the speed at which deals move through your funnel, and it’s determined by four factors:
Pipeline Velocity = (Number of Opportunities × Average Deal Size × Win Rate) ÷ Sales Cycle Length
You can increase velocity by:
- Increasing the number of qualified opportunities (not just MQLs)
- Increasing average deal size (better targeting, packaging, upsell)
- Increasing win rate (better sales process, stronger proof, objection handling)
- Decreasing sales cycle length (better activation, faster decisions, removing friction)
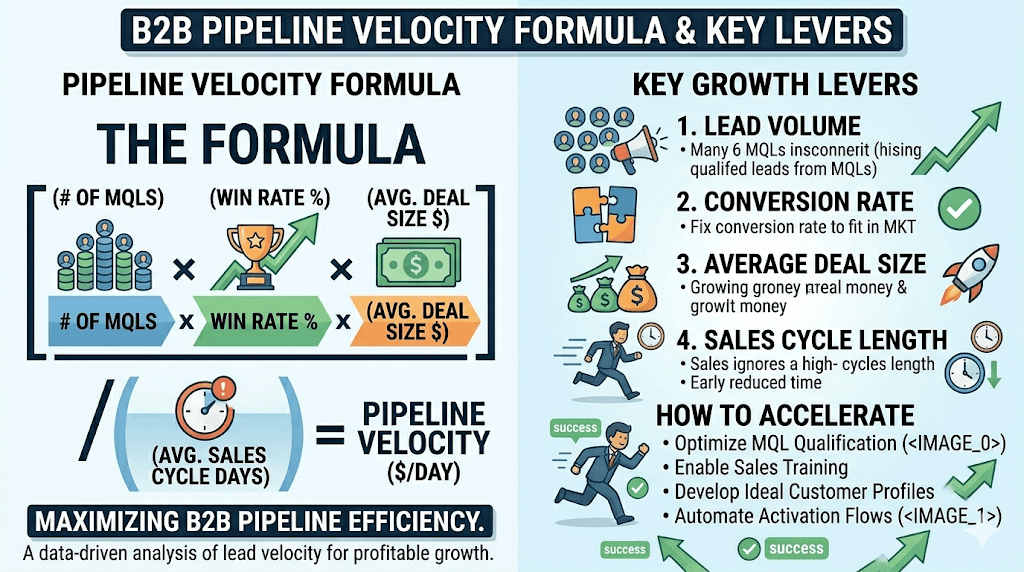
Marketing has a role in all four levers, not just the first one.
Examples of marketing influencing velocity:
- Faster cycle: Better nurture and education pre-demo means prospects come in more informed and move faster
- Higher win rate: Case studies, ROI calculators, and competitive comparison content arm sales and reduce objections
- Bigger deals: Targeting senior buyers, not just practitioners; positioning higher-value packages
Action: Start tracking pipeline velocity monthly. Break it down by source (e.g., inbound vs outbound, organic vs paid). Identify which sources produce the fastest, highest-value pipeline, and invest more there.
5. There’s No Continuous Experimentation on Activation and Conversion
Most B2B marketing teams run experiments on top-of-funnel stuff – ad copy, landing page headlines, CTA buttons.
But the highest-leverage experiments are often lower in the funnel:
- Demo page optimization: Can we increase demo bookings by 10% with a clearer value prop or social proof?
- Demo no-show reduction: Can we cut no-shows from 40% to 25% with better reminder emails?
- Trial-to-paid activation: Can we increase trial-to-paid conversion by improving onboarding or adding a human touchpoint at the right moment?
- Proposal-to-close: Can we shorten decision time with better follow-up sequences or a simpler contract process?
At Intense Digital, we maintain a shared experiment backlog with every B2B client. Each month, we pick the top 2-3 highest-impact tests, run them, measure results, and roll out the winners.
Small improvements compound. A 5% lift in demo bookings + a 10% reduction in no-shows + an 8% improvement in trial activation = meaningful pipeline growth, with zero increase in ad spend.
What “Shared Accountability” Actually Looks Like
One of the ways we work differently at Intense Digital is that we don’t treat marketing and sales as separate kingdoms. We co-own the funnel with our clients – which means we sit in on sales reviews, we have access to CRM data, and we’re measured on pipeline and revenue, not just MQLs.
Here’s what that looks like week-to-week:
Weekly Growth Sync (30 minutes)
- Marketing + Sales + Growth Partner (us)
- Review: MQLs generated, MQL → SQL conversion, pipeline created, deals closing
- Discuss: What’s working? What’s stalling? What should we test next?
- Decide: Start/stop/continue decisions for campaigns, experiments, and outreach
Monthly Growth Review (60 minutes)
- Marketing + Sales + Leadership (CMO/CRO/CEO)
- Review full-funnel metrics: traffic, leads, MQLs, SQLs, pipeline, closed/won
- Analyze: Conversion rates by source, pipeline velocity, win rate trends
- Set: Targets and priorities for next month
Shared Dashboard (Always On)
One source of truth, accessible to everyone:
- Real-time funnel view from visitor to closed deal
- Conversion rates at every stage
- Pipeline value and velocity
- Performance by source/campaign
- Experiment results and rollouts
No more “marketing’s numbers vs sales’s numbers.” One set of numbers, one shared reality.
Three B2B Activation Experiments to Run This Quarter
If you do nothing else after reading this article, run these three experiments in the next 90 days:
Experiment 1: Optimize Your Demo Confirmation Flow
Current state: Prospect books a demo → gets a calendar invite
Test: Add a confirmation email with:
- What they’ll learn in the demo
- What to prepare (e.g., “Think about your top 3 challenges with [problem]”)
- Social proof (e.g., “Join 300+ companies using [product]”)
- Link to short explainer video or customer story
Measure: Demo attendance rate, quality of conversation (sales feedback), demo → SQL conversion
Experiment 2: Implement Behavior-Triggered Sales Alerts
Current state: MQLs are handed to sales in weekly batches or based on lead score alone
Test: Trigger real-time alerts to sales when a prospect takes high-intent actions:
- Visits pricing page 2+ times in 7 days
- Watches a demo video
- Returns to the site 3+ times in a week
- Downloads a bottom-of-funnel asset (ROI calculator, case study)
Measure: Response time, MQL → SQL conversion, sales team feedback
Experiment 3: Add a Post-Demo Nurture Sequence (for No-Decision Prospects)
Current state: Prospect has demo → sales follows up 2-3 times → if no response, prospect goes cold
Test: If prospect doesn’t respond to sales after 2 follow-ups, enter them into an automated nurture sequence:
- Email 1 (Day 7): Recap of what was discussed + link to relevant case study
- Email 2 (Day 14): “How [similar company] solved [problem]” story
- Email 3 (Day 21): ROI calculator or comparison guide
- Email 4 (Day 30): “Still exploring? Here’s what’s new” + re-engage CTA
Measure: Re-engagement rate, nurture → SQL conversion, long-term pipeline contribution
Run one experiment at a time, measure it properly, and roll out winners before moving to the next.
How We Help B2B Brands Connect Marketing to Revenue
At Intense Digital, we work with B2B SaaS and professional services brands to fix the disconnect between marketing activity and revenue outcomes.
Our approach:
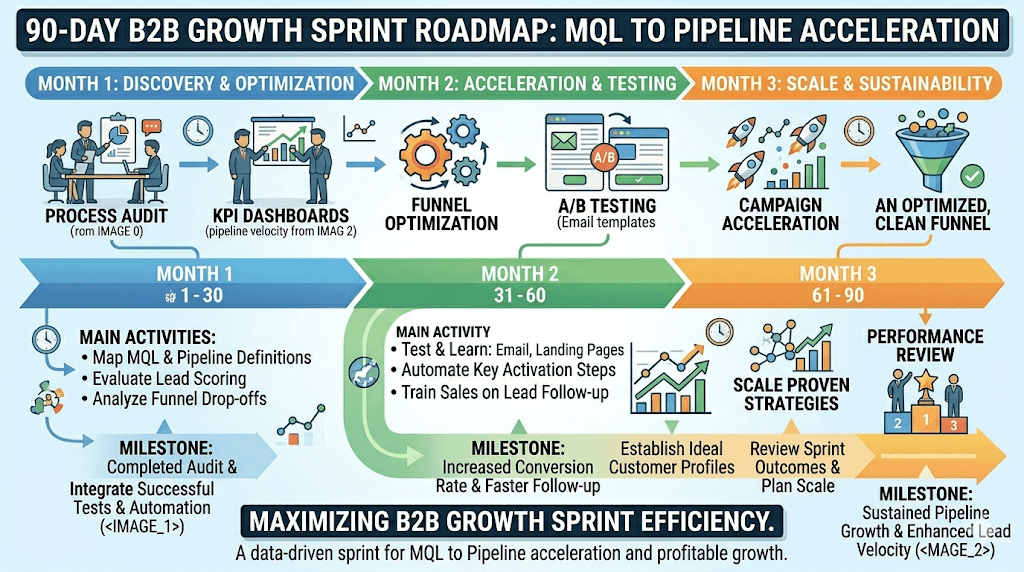
Phase 1: Full-Funnel Diagnostic (Weeks 1-4)
- Map the end-to-end journey from first touch to closed deal
- Audit conversion rates at each stage
- Identify where prospects are stalling or dropping off
- Interview sales to understand lead quality and objections
- Audit tracking and attribution (can you connect marketing source to closed revenue?)
Phase 2: Align Definitions and Build Shared Dashboard (Weeks 5-6)
- Agree on MQL/SQL definitions with sales and leadership
- Build shared funnel dashboard (one source of truth)
- Set baseline conversion rate targets by stage
- Establish weekly/monthly review cadence
Phase 3: Activation and Conversion Experiments (Weeks 7-12)
- Prioritize 3-5 highest-impact experiments (demo flow, trial onboarding, nurture sequences, etc.)
- Implement and test one at a time
- Measure impact on conversion rates and pipeline velocity
- Roll out winners and move to next experiment
We don’t just “run your ads” or “do your content.” We co-own pipeline and revenue targets with your leadership team, and we work as an extension of your growth team – joining standups, reviewing CRM data, and optimizing the whole journey, not just the top.
Real Example: How We Helped a B2B SaaS Brand Increase Pipeline by 47% Without Spending More on Ads
We worked with a West African B2B SaaS company (HR tech) that was generating 120+ MQLs per month, but only 8-12 were turning into SQLs.
Sales blamed marketing for “bad leads.” Marketing blamed sales for “not following up fast enough.” The CEO was frustrated because marketing spend was rising but pipeline wasn’t.
What we did:
Week 1-2: Diagnostic
- Reviewed 90 days of MQL data and sales notes
- Found that 40% of MQLs were wrong fit (wrong company size, wrong industry)
- Found that 30% were right fit but early-stage (doing research, not ready to buy)
- Found that demo no-show rate was 38%
- Sales was following up an average of 1.2 times before giving up
Week 3-4: Alignment
- Redefined MQL with sales: must meet firmographic fit (company size, industry) + intent signal (demo request, pricing page visit, or return visit within 7 days)
- Built shared dashboard tracking MQL → SQL → Opportunity → Closed
- Set weekly sync with marketing, sales, and CEO
Week 5-8: Activation Experiments
- Experiment 1: Improved demo booking page (added testimonial video, clearer value prop) → demo booking rate +14%
- Experiment 2: Sent reminder email 24 hours before demo with prep questions and case study → no-show rate dropped from 38% to 22%
- Experiment 3: Sales got real-time Slack alerts for high-intent behaviors (pricing page visit, repeat visit) → response time improved, MQL → SQL conversion +18%
Week 9-12: Nurture and Scale
- Built post-demo nurture for non-responders (4-email sequence) → recovered 11% of stalled demos as SQLs in following 30 days
- Shifted ad budget away from top-of-funnel content downloads toward bottom-funnel intent campaigns (Google search, retargeting)
- Result: MQL volume dropped slightly (to ~100/month), but MQL → SQL conversion went from 8% to 19%, and pipeline value increased 47%
The CEO’s reaction: “For the first time, I actually understand where our pipeline is coming from and what we can do to grow it.”
From Lead Gen to Revenue Engine
Most B2B marketing is still stuck in a lead-gen mindset: generate leads, hand them to sales, hope for the best.
The new model is revenue marketing: own the full journey, co-own conversion rates with sales, measure impact on pipeline and revenue, and run continuous experiments to improve every stage.
It’s less glamorous than launching a big brand campaign. But it works. And it scales.
At Intense Digital, we’re growth partners, not just an agency. We design and optimize the full B2B funnel, we measure what your CFO cares about (pipeline, revenue, CAC payback), and we work as an extension of your team – joining your reviews, sharing your dashboard, and co-owning your growth targets.
Ready to connect your marketing to revenue?
Book a complimentary 30-minute B2B funnel audit. We’ll walk through your current journey, identify where prospects are dropping off, and show you what a 90-day growth sprint could unlock for your pipeline.